



Key Takeaways
- Hidden cost: Technical debt represents 20% to 40% of the value of the average enterprise technology estate, and 10% to 20% of every dollar earmarked for new product work is redirected to servicing it.
- Productivity, not tickets: The damage rarely appears as a stalled ticket. It appears as features taking 60% to 80% longer than planned while engineering headcount keeps rising.
- Portfolio mindset: Mature organizations manage debt as a portfolio decision, allocating 15% to 20% of engineering capacity to reduce every cycle rather than waiting for a heroic refactor.
- Foundation first: The highest-leverage debt to retire is rarely the most visible. It is the foundation layer that makes every other change cheaper.
The Roadmap Slip Nobody Wants to Name
Picture the quarterly business review for a product organization that grew from 40 engineers to 90 over three years. The headcount is up. Salary spend is up. The roadmap slide is the same one that was shown last quarter, just with three features pushed right. The CEO asks the obvious question. The CTO names the obvious culprits: scope, dependencies, an unexpected security review. Nobody says the actual word, because the word lives in the codebase, not the slide.
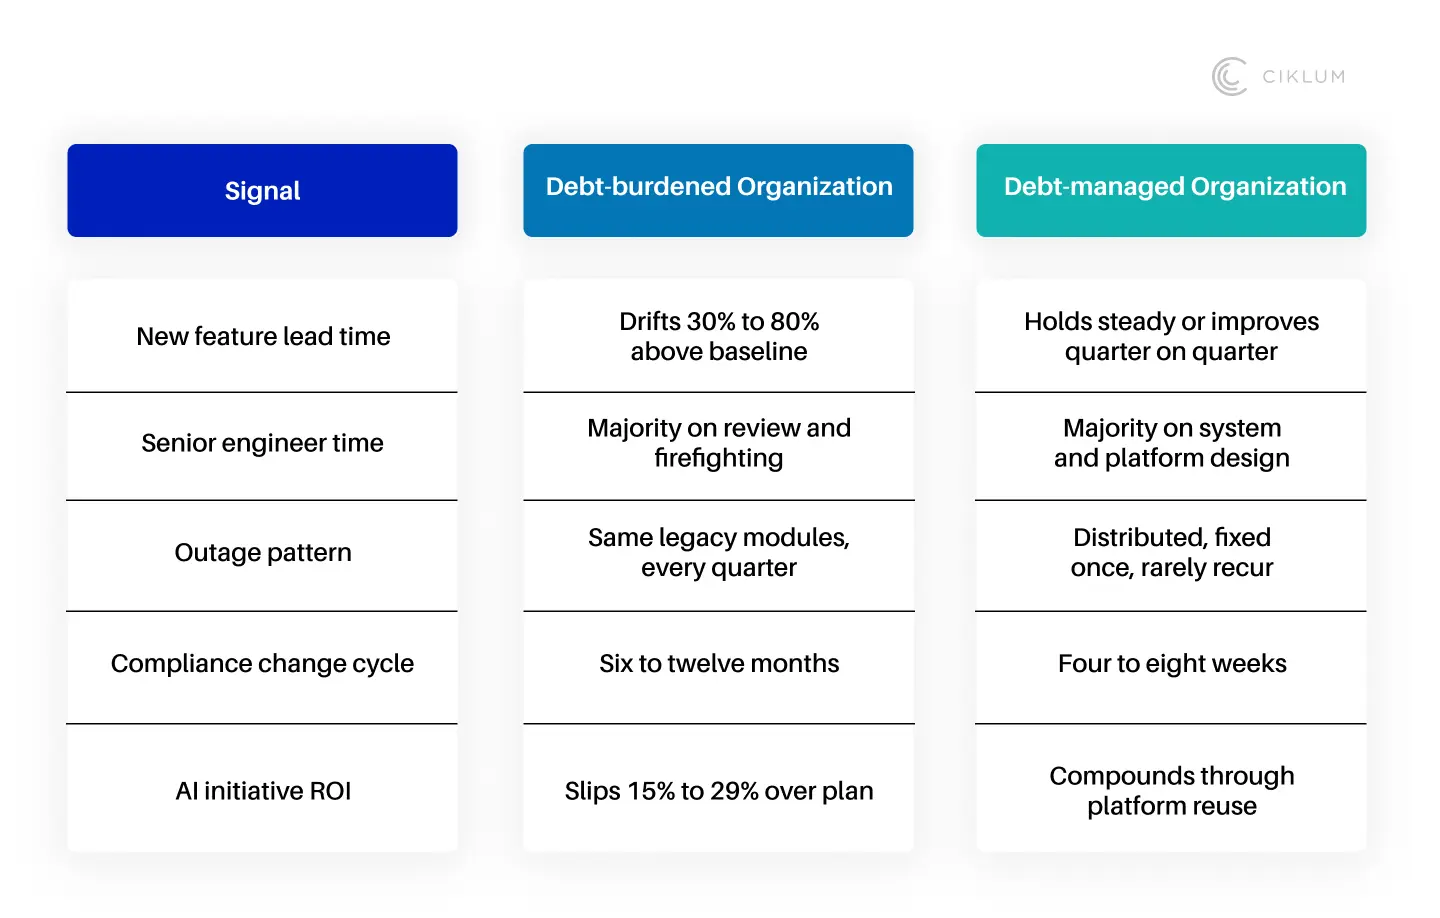
The pattern is rarely a single failure. New hires take longer to ramp. Senior engineers spend most of their week reviewing changes generated by other people, including AI assistants, rather than designing systems themselves. Outages cluster in the same legacy modules, quarter after quarter. A compliance change that should take three weeks needs three months. None of this looks like a crisis on any single day. It compounds slowly enough that each individual missed deadline can be explained away.
That compounding has a name and a measurable cost. McKinsey's enterprise research, drawing on survey data from CIOs at more than 50 large organizations, found that technical debt represents 20% to 40% of the value of the entire technology estate, and that 10% to 20% of every dollar earmarked for new product work is redirected to addressing debt instead. Sixty percent of the CIOs surveyed reported that the load had grown noticeably worse over the previous three years. The signal is not coming from the engineering function. It is showing up on the P&L, in the modernization roadmap, and in the quarterly business review.
Why Software Velocity Decays
Ward Cunningham introduced the technical debt metaphor at OOPSLA in 1992 for a precise reason. Shipping a workaround resembles taking on a loan. The loan itself is not the problem. The interest that compounds against every future change is the problem. Three decades of practice have validated the framing across enterprise software portfolios. The compounding takes four reinforcing forms.
The first is shortcut inheritance. Every new feature built on top of a workaround inherits that workaround, plus any inconsistencies it introduced. Carnegie Mellon's Software Engineering Institute documents this effect across multi-year studies of enterprise codebases in its book, with the share of total engineering time spent servicing legacy decisions rising over time unless deliberately managed.
The second is the way debt erodes delivery throughput rather than blocking it outright. Stripe's Developer Coefficient study, conducted with Harris Poll, found that developers spend an average of 17.3 hours each week on maintenance, debugging, and refactoring. For a 100-engineer team, that is the equivalent of nine full-time hires every week, paid for and absorbed without ever appearing as a project line. The third is reliability concentration. Debt clusters in the parts of the codebase that are oldest, most heavily integrated, and least owned, which is also where the visible failures eventually originate.
The fourth is talent erosion, and it shows up faster than most leaders expect. Senior engineers feel debt before management measures it. They feel it in build times, on-call frequency, code review friction, and the share of the day spent fighting the codebase rather than shipping into it. The 2024 Accelerate State of DevOps report from DORA shows the gap between elite and low performers widening to 127x in change lead time and 182x in deployment frequency, with the separating drivers concentrated in test coverage, deployment automation, and architectural coherence. Ciklum's own work on AI-driven engineering in healthcare and AI-accelerated product cycles in retail consistently finds the same pattern: the senior engineers who stay are the ones whose day shifts from firefighting to system design.
The contrast between organizations that have made that shift and ones that have not is sharp.
Where the Cost Actually Shows Up on the P&L
The financial signature of unmanaged technical debt is consistent across industries. Roadmap commitments slip by a quarter, then two. Customer-visible incidents take longer to resolve. Compliance and security exposure rises in the most legacy-dense parts of the estate. Product teams begin to discount their own forecasts. Sales loses pipeline confidence in delivery dates. New product investment generates less and less marginal output, even when capital allocation increases.
McKinsey's analysis of 220 companies found that organizations in the bottom 20% for technical debt management were 40% more likely to experience incomplete or canceled IT modernization programs, while those in the top 20% achieved 20% higher revenue growth.

A Four-Move Playbook for Managing Debt as a Portfolio
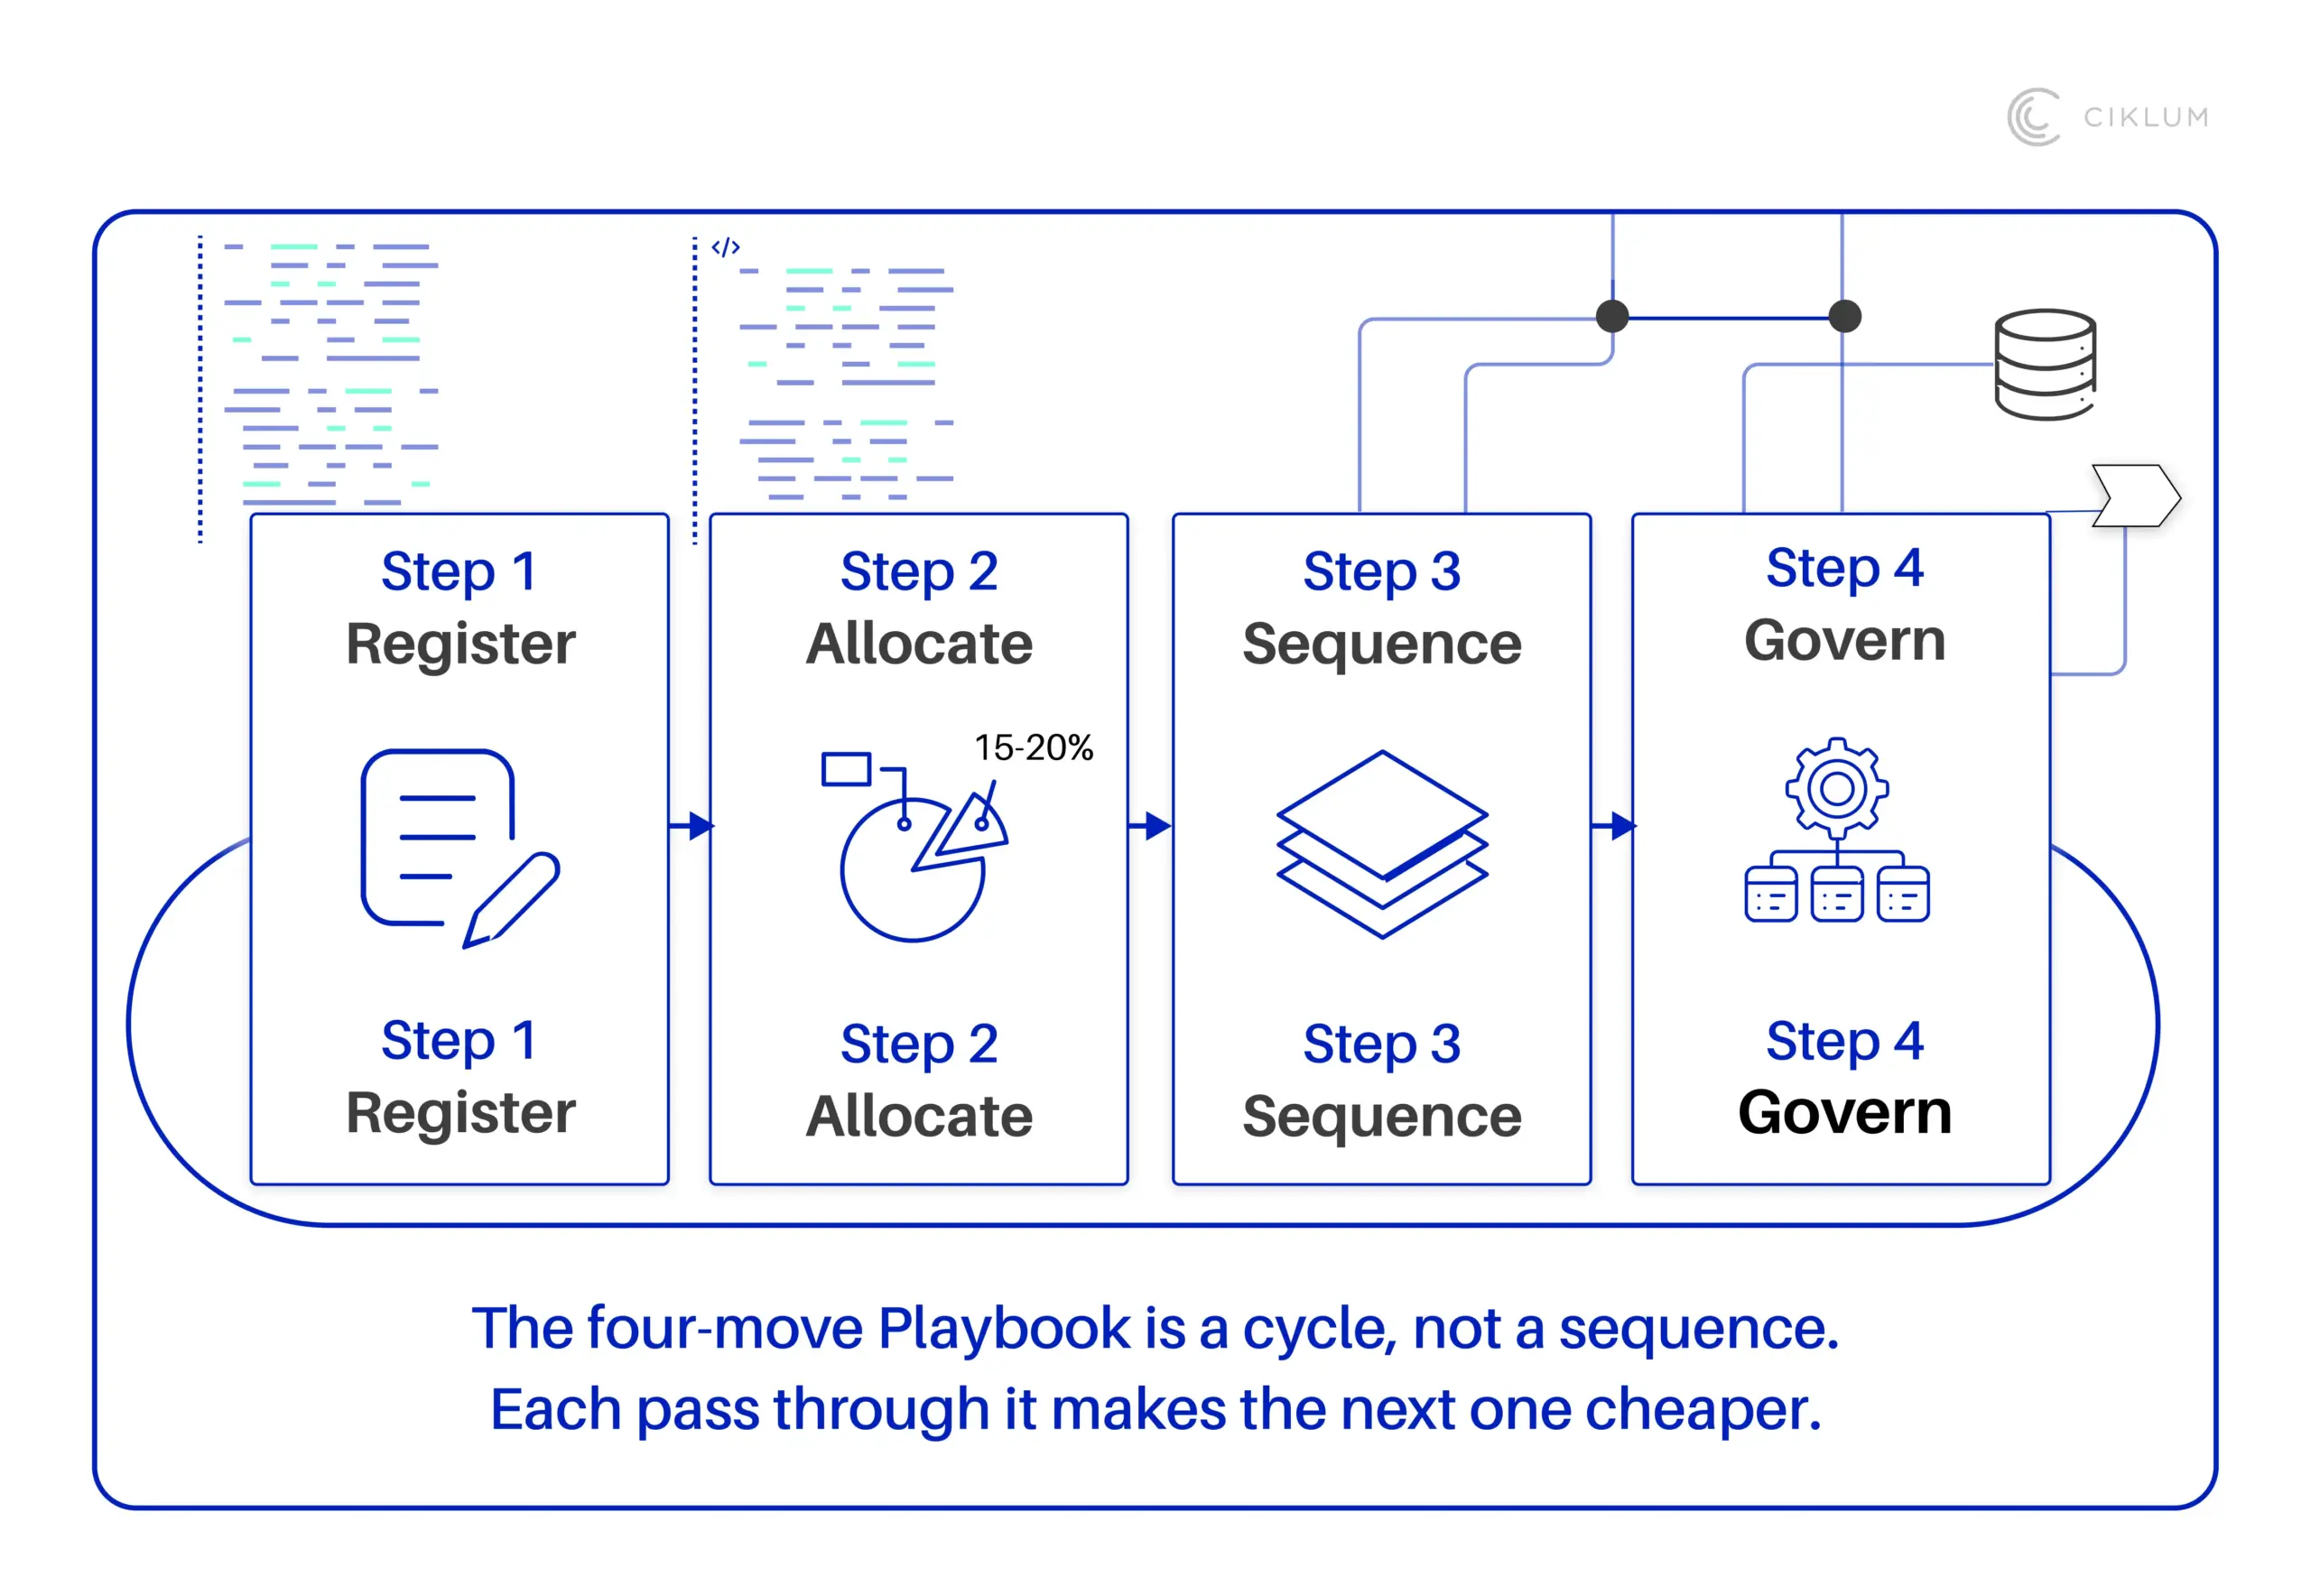
Organizations that contain the impact of technical debt share a recognizable operating pattern, and none of it depends on a heroic refactor. Four moves do most of the work.
- Make the debt visible: Create a formal record of technical debt. This register should describe each item, assign responsibility, estimate the overall cost, and identify when the debt is likely to become urgent or damaging. Technical debt that exists only as informal knowledge is easily overlooked and underprioritized, but when tracked in a register, it can be evaluated, prioritized, and addressed systematically.
- Allocate capacity regularly: Dedicate a portion of your team’s time and resources in every cycle to addressing technical debt, making it part of the standard planning process instead of treating it as an occasional side project. Approaching debt work as a consistent commitment, rather than deferring it for the future, prevents the burden from silently accumulating and restores momentum in delivery.
- Prioritize foundational improvements: Focus first on the underlying aspects of the system that enable future progress such as test coverage, automation, system visibility, and core platform elements. Tackling the most obvious or glamorous code fixes rarely delivers the greatest impact. Instead, resolving foundational issues lowers the cost and risk of all future changes.
- Treat architecture as a first-class product: Recognize that architectural decisions shape the ease and cost of every change that follows. Leading organizations manage their architecture and shared platforms intentionally, with clear ownership, roadmaps, and metrics, instead of leaving these responsibilities scattered and undefined.
The fastest progress in our experience comes from organizations that combine all four moves with an incremental modernization pattern, rather than a big-bang rewrite. Ciklum's guide to legacy modernization with AI-augmented engineering walks through the strangler-pattern approach we use to make this practical.
Two Organizations That Made the Shift
A global automotive manufacturer working with Ciklum had reached the point where field-technician issue resolution was constrained by both the slowness of the internal knowledge base and the eight-hour business window of UK-based support. The team restructured its delivery model around stream-aligned squads supported by a shared agentic platform trained on decades of vehicle-engineering knowledge. The visible win was the agentic system itself. The structural win was that the platform team owned shared services, the codebase was finally instrumented for telemetry, and debt was tracked in a register rather than tolerated as background noise. Diagnoses that previously took several days now take under an hour, support runs 24/7, and the organization has saved more than £1 million.
A leading US footwear brand sat at the opposite end of the debt curve. Its Apropos POS system was reaching end-of-life and was actively constraining the brand's ability to evolve its retail and e-commerce experience. Ciklum migrated the estate onto a cloud-based Aptos platform and introduced mPOS into stores. The migration cut maintenance and hardware costs, accelerated store operations, and gave the brand a platform that was finally ready to support new commerce experiences instead of resisting them. In both cases, the debt position improved before the business outcome did, and the business outcome was the consequence of the debt position improving.
In Summary
Technical debt is not an engineering hygiene topic. It is a portfolio decision that quietly determines whether new product investment compounds or cancels itself out. Organizations that treat it that way, by making debt visible, allocating consistent capacity to reduction, sequencing foundation work first, and governing architecture as a product, consistently outperform peers on revenue growth, modernization completion rates, and AI program ROI.
Frequently Asked Questions
1. How big is the technical debt impact on business in an average enterprise?
McKinsey's research found that technical debt represents 20% to 40% of the value of the entire technology estate, and that 10% to 20% of every dollar earmarked for new product work is redirected to servicing it. CISQ estimates that poor software quality costs US organizations $2.41 trillion per year. For most enterprises, that places technical debt among the three largest sources of value leakage in the business, alongside under-managed data assets and idle infrastructure.
2. Can technical debt ever be fully eliminated?
No, and trying to is usually counterproductive. Some debt is deliberate, taken consciously to hit a market window, and economically rational. The discipline is to keep total debt below the threshold where compounding interest starts dominating throughput. McKinsey notes that pushing debt below 10% of the technology estate rarely creates additional value, since some debt is not worth paying down.
3. What is the single highest-leverage move to start reducing debt?
Build a debt register and allocate a consistent capacity slice (commonly 15% to 20% per cycle) to working items off it. Most organizations that reduce debt successfully do so through steady allocation over many quarters rather than through a one-time refactor program. DORA metrics typically begin to improve within 8 to 12 weeks once allocation becomes a budget line rather than an ambition.
4. When should an organization bring in external engineering support?
Two windows produce the highest return. The first is during the initial assessment, where outside perspective on architecture and dependency mapping cuts through political friction faster than internal facilitation. The second is during platform engineering investment, where engineers with prior platform and CI/CD experience compress build time from years to quarters. Both require bandwidth that debt-stretched in-house teams rarely have spare.

By Ciklum Editorial Team

Ciklum’s Editorial Board is a collective of experienced writers and industry experts, bringing together perspectives shaped by real-world engineering and delivery experience. Through collaborative insights, the team explores how technology, AI, and digital innovation move from concept to execution across industries.
Blogs
Discover Similar Insights

Healthcare Digital Transformation Challenges: Why Programs Fall Short Post-Implementation
Learn More
AI-Ready Data Infrastructure for Financial Services: A Practical Guide for UK Banks and Insurers
Learn More
Designing Scalable Software Architecture for High-Growth Products
Learn More
Speed to Market: How to Accelerate Product Development Without Compromise
Learn More